Minimum Wage / Home Affordability by Metro Area (Jan 1, 2019)
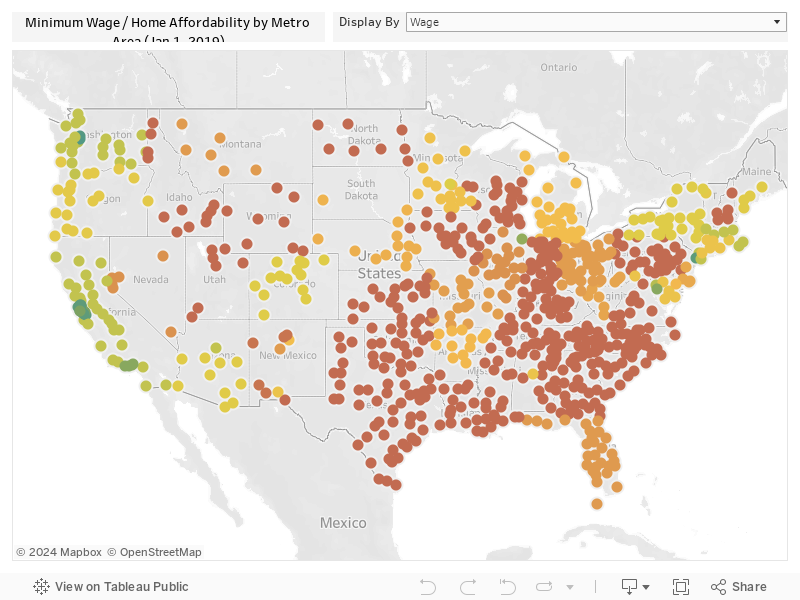
On January 1, 2019, minimum wage increased in a record number of U.S. cities and states. However, a higher minimum wage doesn't always correlate with affordability. This chart allows you to compare the most recent minimum wage of major U.S. metro areas, with the relative affordability of median-priced housing for the same wage earner, based on the debt-to-income ratio for 2,000 hours at minimum wage. Values in blue are generally considered "better" (higher minimum wage, or lower debt-to-income ratio, depending on the filter).
While home prices are not a perfect proxy for cost of living, it's noteworthy that many of the cities with a low minimum wage actually rank better than the cities with higher minimum wages when housing affordability is factored in. (To avoid overweighting some expensive markets, we've capped the ratio of home prices to annual income at 25).
The one outlier we wanted to call out is Birmingham, Alabama. The city's minimum wage laws were overturned by the state legislature, but since the city is making progress in its lawsuit against the state, we decided to show Birmingham's minimum wage at intended rate ($10.10).
Median home price data provided by Zillow. We're using median housing prices from December, 2018. The data used for this chart should represent the complete list of metro areas where the minimum wage is higher than the federal requirement of $7.25/hour.