Kansas City - Home Equity Index
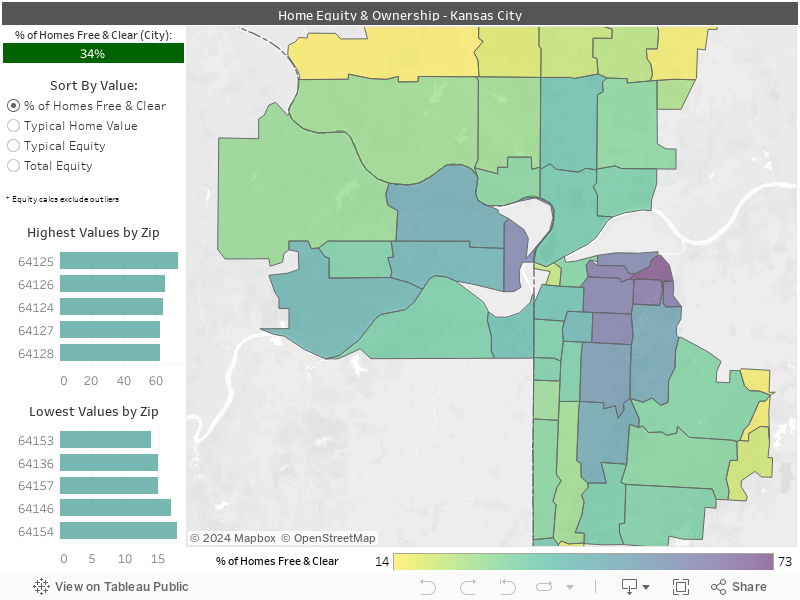
This interactive chart visualizes ownership and home equity data for Kansas City (both MO and KS).
Kansas City Zip Code 64125 has the highest percentage of homes owned free and clear, with an astonishing 73% of homes owned outright (within the top 2%, nationally). The Zip Code with the highest median equity is 64113. Homeowners with mortgages in this Zip Code are estimated to have about $128k in home equity, among the top 20% of all Zip Codes nationally. Overall, 34% of Kansas City residents own their homes free and clear, slightly below the national average.
With a minimum wage of $8.60/hour, Kansas City is relatively affordable for earners on the lower end of the income spectrum according to our housing affordability ratio. Experts have a range of opinions about whether it's better to a renter or a buyer in Kansas City, but like most midwest cities, housing prices seem relatively stable.
The Walletwyse Home Equity Index estimates positive equity in owner-occupied homes for U.S. states, cities and Zip Codes. This includes median home values and mortgage balances, the percentage of homes owned free and clear, and aggregated total equity. The release schedule for our city maps is published here, along with the methodology for the index.
While you're visiting, calculate the cost of home ownership in your area with our progressive Home Purchase Calculator. Choose from Basic, Advanced or "Wyse" modes to understanding everything from the fundamentals to complex concepts like the opportunity cost of buying a home.
Our goal at Walletwyse is the thoughtful curation of financial information to help you make informed, bias-free decisions, so we are unaffiliated with lenders and brokerages.