New York City - Home Equity Index
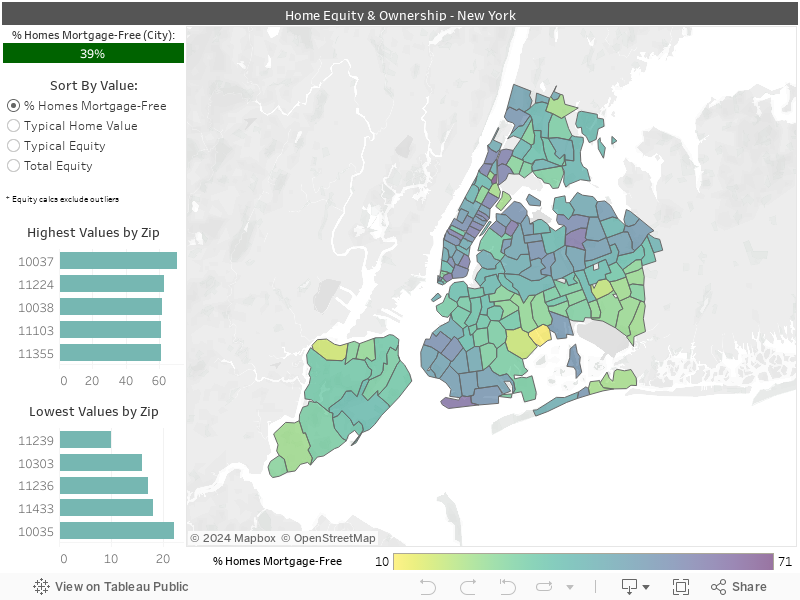
This interactive chart visualizes ownership and home equity data for New York City. Manhattan Zip Code 10024 has the highest aggregate home equity, at a whopping $42+ billion, making it the Zip Code with the most owner-occupied equity in the United States. On the other hand, the Zip Code with the highest percent of homes owned outright is 10037. In that Central Harlem Zip Code, 71% of homes are held free and clear, putting it in the top 2% of Zip Codes nationally on that measure. Overall, 39% of New York City homes are owned outright, very close to the national median.
Despite a minimum wage of $15/hour, New York is somewhat unaffordable for earners on the lower end of the income spectrum according to our housing affordability ratio (although still far better than several other coastal hubs). Experts generally indicate that renting in New York and investing the difference is more financially savvy than buying in 2019, although opinions vary.
The Walletwyse Home Equity Index estimates positive equity in owner-occupied homes for U.S. states, cities and Zip Codes. This includes median home values and mortgage balances, the percentage of homes owned free and clear, and aggregated total equity. The release schedule for our city maps is published here, along with the methodology for the index.
While you're visiting, calculate the cost of home ownership in your area with our progressive Home Purchase Calculator. Choose from Basic, Advanced or "Wyse" modes to understand everything from the fundamentals to complex concepts like the opportunity cost of buying a home.
Our goal at Walletwyse is the thoughtful curation of financial information to help you make informed, bias-free decisions, so we are unaffiliated with lenders and brokerages.